Transparent Makeup AI Metrics: A Complete Guide
Explore how transparent makeup AI metrics provide insights into fairness, safety, and performance, enhancing consumer trust through data-driven transparency.
Estimated reading time: 12 minutes
Key Takeaways
- Definition of transparent makeup AI metrics as data-driven scores for fairness, safety, and performance.
- Overview of AI’s role in decoding product claims and improving R&D workflows.
- Six core metric categories, from technical performance to consumer sentiment.
- Step-by-step AI pipeline that ensures reliable, auditable metrics.
- Real-world benefits for manufacturers and consumers, plus ethical considerations.
Table of Contents
- Understanding Transparent Makeup
- The Role of AI in the Beauty Industry
- Deep Dive into Transparent Makeup AI Metrics
- How AI Metrics Are Developed
- Benefits for Manufacturers & Consumers
- Practical Applications & Case Studies
- Challenges & Ethical Considerations
- Future Trends & Innovations
- Conclusion
Transparent makeup once meant a sheer, natural finish on skin. Today, it also means transparent product information—clear ingredient lists, sourcing details, safety reports, and algorithmic fairness scores. Instead of vague marketing claims, brands now use transparent makeup AI metrics to turn promises into auditable numbers that build consumer trust.
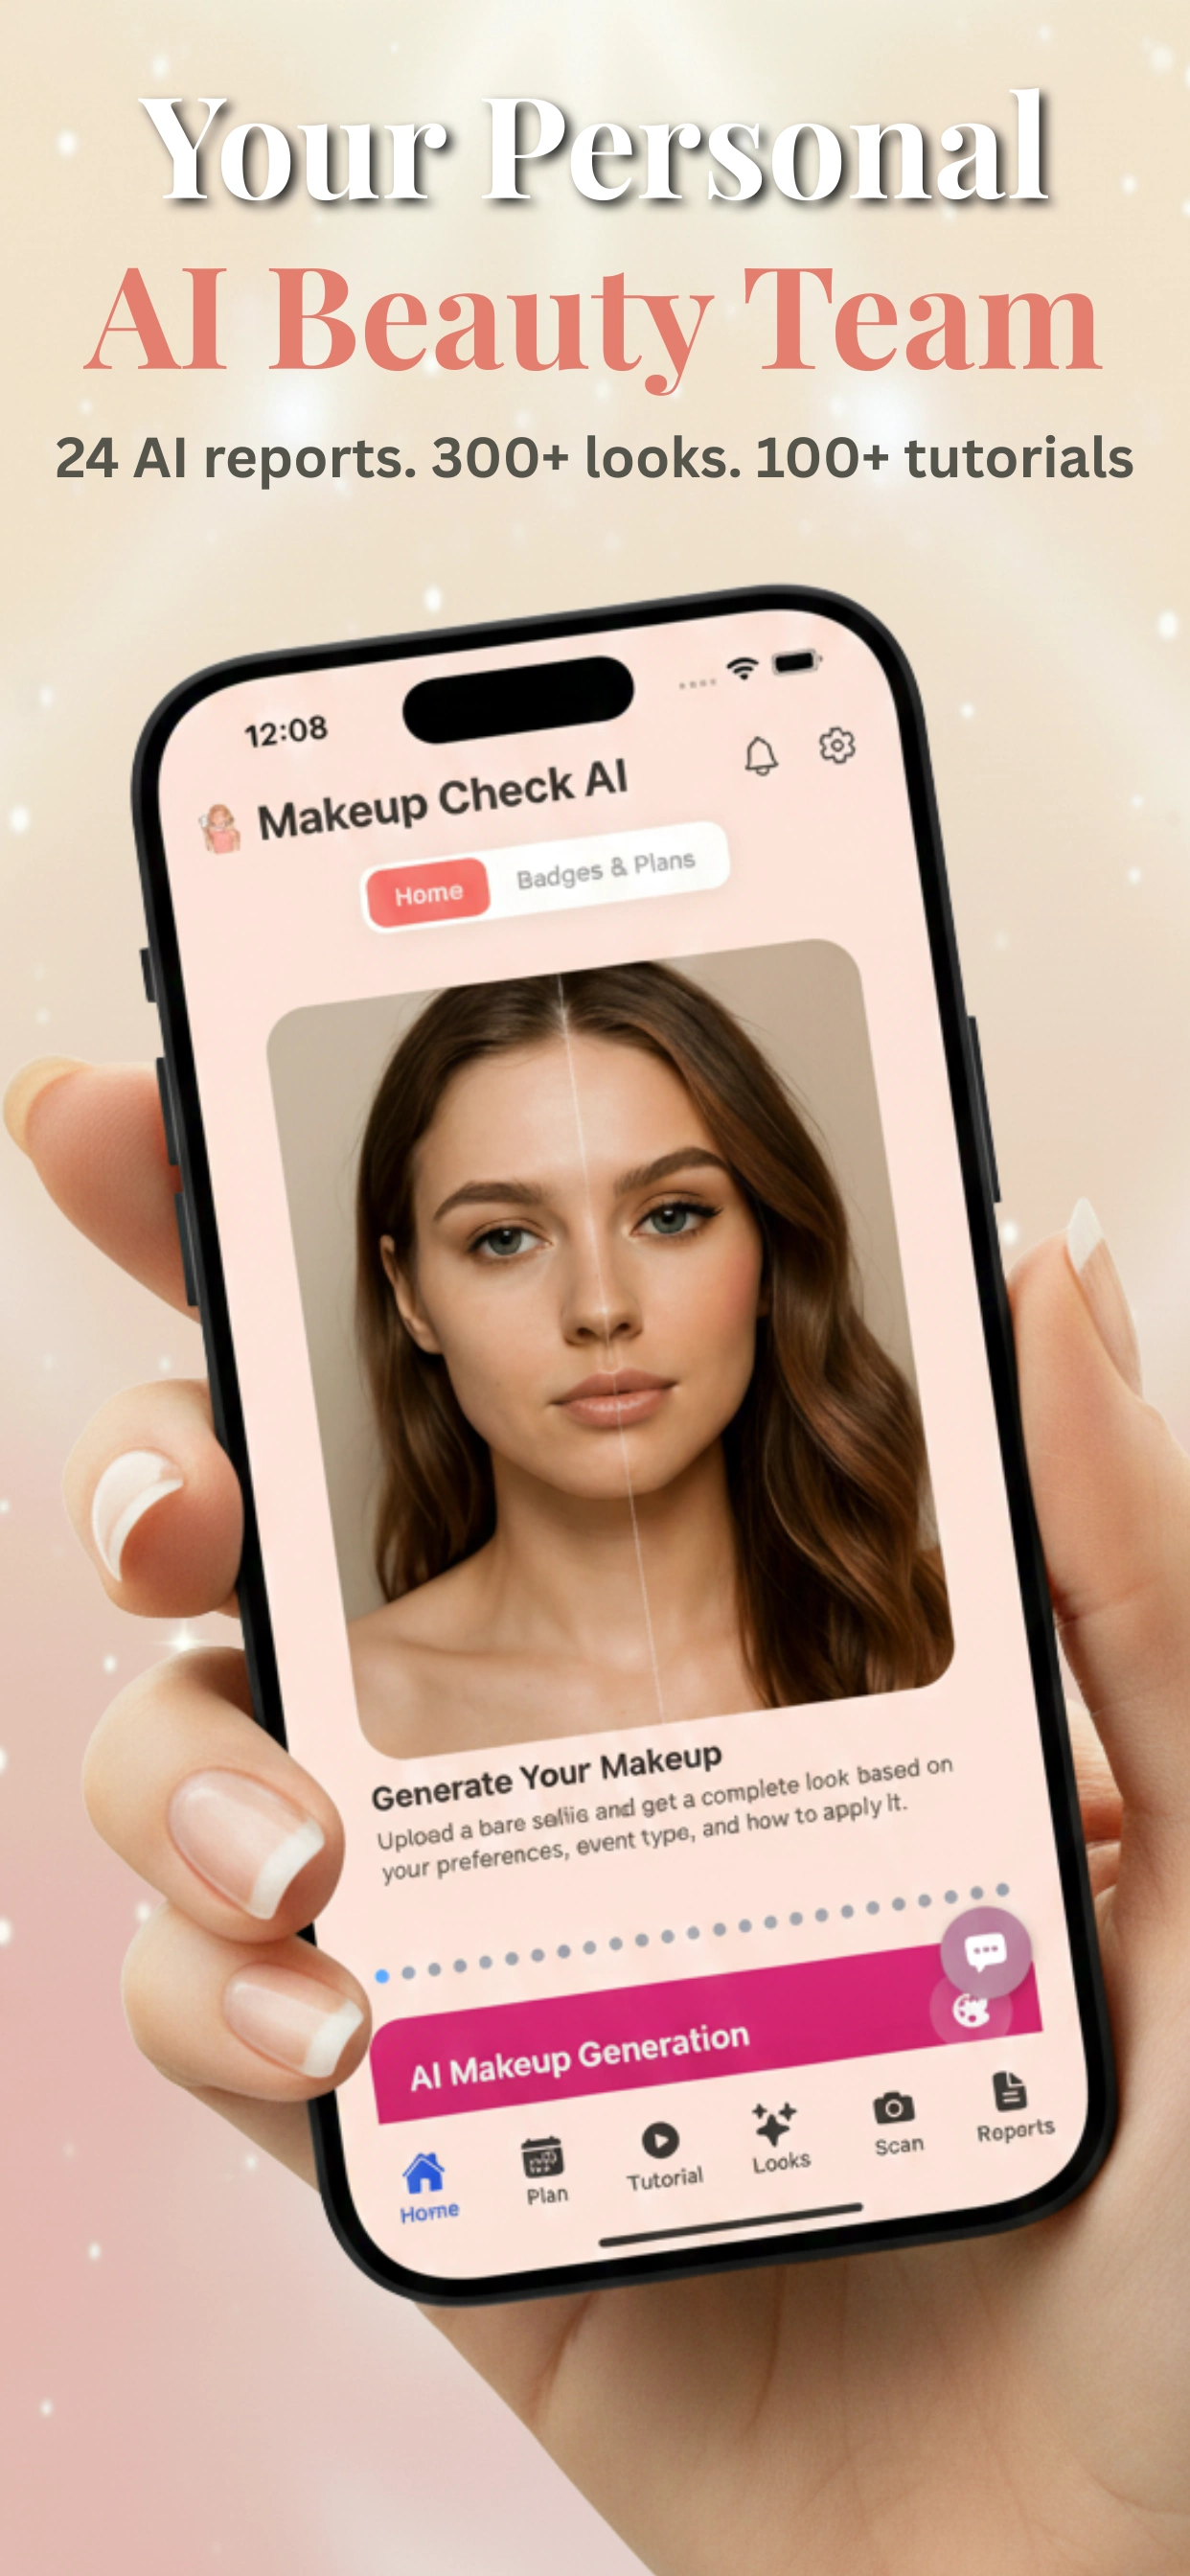
Tools like Makeup Check AI quantify fairness gaps and ingredient clarity, giving brands and consumers clear, audit-ready transparency.
Section 1: Understanding Transparent Makeup
Definition and Scope
Transparent makeup means full disclosure of every formula component: ingredients, sourcing, safety testing, and efficacy data. It transforms shades and finishes into stories of authenticity.
Why Transparency Matters
With rampant greenwashing, consumers need verifiable proof. Studies show 72% of shoppers abandon brands that hide ingredient details, while regulators demand clear labeling.
Key Elements of Transparency in Cosmetics
- Ingredient clarity: plain-language summaries and INCI listings.
- Efficacy proof: lab results on wear time and skin reactions.
- Ethical sourcing: traceable records for cruelty-free and fair-trade claims.
Section 2: The Role of AI in the Beauty Industry
AI Applications in Makeup R&D
- Ingredient formulation prediction: models forecast texture, coverage, and irritation risk.
- Virtual try-on & shade matching: computer vision recommends shades via Virtual Makeup Try-On.
- Skin-analysis algorithms: detect redness, pigmentation, and suggest products.
- NLP for claim verification: analyze marketing copy for truthfulness and sentiment.
How AI Produces Metrics
- Performance scores: accuracy, precision, recall, and F1-score.
- Fairness assessments: error-rate gaps across demographics.
- Explainability tools like SHAP and LIME to highlight feature importance.
- Safety indices based on ingredient databases and sourcing logs.
Section 3: Deep Dive into Transparent Makeup AI Metrics
What Are AI Metrics?
Transparent makeup AI metrics are quantitative measures that turn complex model behavior and formulation data into digestible KPIs.
Six Main Metric Categories
- Technical Performance
- Accuracy: percent correct shade matches or classifications.
- Precision & recall: balance of false positives/negatives.
- F1-score: harmonic mean of precision and recall.
- Fairness & Bias
- Error-rate gaps across skin tones, ages, and genders.
- Disparate impact ratios and opportunity differences.
- Explainability
- SHAP and LIME outputs showing feature influence.
- Model cards detailing training data, use cases, and limits.
- Ingredient & Safety Transparency
- Clarity scores: percent of ingredients with plain-language descriptions.
- Allergen flags: share of potential irritants detected.
- Document completeness: lab reports and safety certificates included.
- Sustainability & Ethics
- Carbon footprint index per product unit.
- Ethical sourcing score: traceability depth.
- Packaging recyclability rating.
- Consumer Sentiment & Usability
- Sentiment analysis: positive vs negative review ratio.
- Return rate: percent of products returned due to mismatch.
- Try-on success rate: virtual matches leading to purchase via shade-match guide.
Section 4: How AI Metrics Are Developed
AI Analysis Pipeline
- Data Collection & Preprocessing
- Ingredient data standardized and cross-checked.
- Lab photos measure coverage and color drift.
- User selfies with consented demographics for fairness.
- Text data from claims and reviews for sentiment analysis.
- Steps: anonymize data, normalize color spaces, clean text.
- Model Training & Inference
- NLP classifiers tag claims and analyze sentiment.
- Computer vision tracks wear-time and shade match.
- Recommender systems suggest products via collaborative filtering.
- Metric Computation
- Compute accuracy, precision, recall, F1 for each task.
- Derive fairness metrics like subgroup gaps.
- Calculate clarity scores, safety ratings, and carbon indexes.
- Aggregate consumer KPIs such as satisfaction and return rates.
- Dashboards & Reporting
- Interactive dashboards showing KPIs by product and demographics.
- Public/internal reports on transparency and sustainability metrics.
- Audit logs ensure traceability of data and model changes.
Section 5: Benefits for Manufacturers & Consumers
Benefits for Manufacturers
- Objective benchmarking with uniform metrics.
- Accelerated R&D via early risk identification.
- Regulatory alignment with documented evidence.
- Brand differentiation through fairness and sustainability scores.
Benefits for Consumers
- Safer recommendations with inclusive fairness metrics.
- Clear ingredient insights and allergen identification.
- Improved shopping experience with data-driven insights.
- Higher satisfaction and loyalty from transparent scoring.
Section 6: Practical Applications & Case Studies
Case Study A: Fair Shade Matching
A retailer implemented a try-on dashboard with fairness scores by skin tone, boosting satisfaction by 30% for darker tones.
Case Study B: Ingredient Transparency Pipeline
An e-commerce brand standardized INCI data and flagged allergens automatically, reducing customer queries by 25% and returns by 15%.
Case Study C: Wear-Time and Oxidation Tracking
A lab used computer vision to monitor oxidation, cutting formulation errors by 50% and speeding launches by 20%.
Section 7: Challenges & Ethical Considerations
Technical Challenges
- Data quality: lack of diverse skin tones skews metrics.
- Integration complexity across labs and apps.
- Trade-offs between accuracy, fairness, and explainability.
Ethical Considerations
- Continuous bias monitoring to prevent discrimination.
- Privacy & consent: anonymize selfies and limit data collection.
- Explainability: users should understand and override AI recommendations.
Section 8: Future Trends & Innovations
Predicted advances include:
- Personalized transparency dashboards based on individual skin profiles.
- Blockchain-linked provenance for tamper-proof sourcing.
- Integrated sustainability indices combining water, carbon, and recyclability.
- Real-time monitoring of model drift and fairness.
- Audit-ready metrics compliant with emerging regulations like the EU AI Act.
Conclusion
Transparent makeup AI metrics usher in evidence-based beauty by quantifying fairness, safety, and performance. Brands optimize R&D and stand out, while consumers shop with confidence. As AI tools for shade matching and analysis become ubiquitous, these metrics will define the future of beauty.
Discover our transparency tools in the Makeup Check AI app and subscribe for updates.
FAQ
- What are transparent makeup AI metrics? They are quantitative scores that measure the fairness, safety, and effectiveness of makeup products and the AI behind them.
- Why are these metrics important? They turn vague claims into verifiable data, building consumer trust and ensuring regulatory compliance.
- How can brands implement these metrics? By integrating ingredient databases, computer vision, and NLP pipelines to compute performance, fairness, and sustainability scores.
- How can consumers use these metrics? Shoppers can compare brands, make safer purchases, and avoid greenwashing by consulting transparency dashboards.